Through this writeup, I have attempted to answer 2 important questions that I think helps one find good investment opportunities. The questions are :
- Is it a good business in terms of quality and one with headroom for growth?
- Does the current price offered by the market make the investment attractive?
The process and reasoning behind answering these questions has been documented in the sections : The Story and The Numbers.
The Story
Intro, Overview and History : What
About Latent View (From RHP)
LatentView is among the leading pure-play data analytics services companies in India and has emerged as one of the most trusted partners to several Fortune 500 companies in the recent years. It has presence in the top 5 analytics markets in the world with subsidiaries in the United States, United Kingdom, Germany, Netherlands, and Singapore. The company was founded in 2008 by Venkat Vishwanathan. The company went public in 2021 through a record breaking IPO with a subscription of 330 times.
Industry and Business : How, Why

What is Data Analytics ?
Simply put, data analytics is decoding the “stories” hidden in the data. Data, when viewed in its raw form, may not mean much but when presented in a particular form, can reveal valuable insights. Here is a basic example on how data analysis might help a company.
ex : Suppose we have sales data of a company that sells beverage (raw form) as T,T,C,T,C,T,T,C,T where T : Tea , C : Coffee.
On basic visual inspection, we can determine the sales to be 3 for coffee and 6 for tea, meaning, for the given sample size, we can infer that Tea is twice as likely to be sold compared to coffee. This “story” can help the company discover aspects about their operations. For instance, they might look into why there is a clear majority for Tea sales.
Data analysis involves using various tools and techniques to carefully examine large amounts of information to find patterns, trends, and insights that can help businesses make smarter decisions and understand customer behaviour / patterns better.
The 4 phases of Data Analytics
Data analytics can be broken down into 4 segments. I consider them as different phases of the long process of data analytics from start to end.
Enterprise Data Management (EDM) (Preparation) : This segment is the first step towards analysing the data. It ensures that the data from the enterprise is accurate, consistent and available for analysis and further use. To use an analogy, this is similar to a carpenter assembling all his tools and blocks of wood in his workbench before he begins to work on his piece.
Descriptive and Diagnostic (Looking Back) : This is the next phase where historic data is summarised and helps the business gain insights about its past. Many techniques of visualization and other pictorial representations are used. This part answers the question : “What has happened in the past?”
Predictive Analysis (Looking Ahead) : As the name suggests, this phase involves the usage of historical data, mathematical algorithms and machine leaning tools to predict future scenarios and outcomes that the business might face. This phase answers the question : “What is likely to happen in the future?”
Prescriptive Analysis (Providing Solutions) : This is the final and most technically complicated part of Data Analytics. This phase uses all the outputs from the first 3 parts to give provide an optimal “solution”. It involves the usage of tools such as simulation and other optimisation techniques. This phase answers the question : “How can it be done better?“
Why will companies incorporate data analytics?
The surge in data analytics (DA) spending across diverse industries is driven by the undeniable value it brings to businesses, a trend expected to persist in the future. The raw material for DA is data. Data that directly comes from the business’s operations itself. This means that whatever the analysis points to is a reflection of what is actually taking place. Even in a relatively simple / straightforward business, there are numerous aspects that need attention, resource allocation and appropriate action and even the best of managements, at times, find it difficult to identify and correct the issues that are holding their business back. Data analytics will simply enhance and aid this process. It is not meant to replace the traditional decision making process but rather provide a number-backed confirmation. In case the management finds the results of the analysis to be surprising or in contrast to their beliefs, it will cause them to probe further and may even lead to a change in their outlook.
How will the growth take place?
I shall present 2 broad categories that I think most companies will fall under and the subsequent process that shall take place in the future when it comes to data analytics spending :
1. The Laggards initiating DA spending
2. The Leaders increasing DA spending
The Laggards initiating DA spending: The untapped potential in majority of companies across different sectors with no incorporation of data analytics. This includes various small and medium enterprises that may at present, consider data analytics as a “premium” service that they cannot afford to allocate capital for but eventually begin DA spending.
One of the major factor that has resulted in companies being fed with massive amounts of consumer data is the transformation of businesses that were previously operating physically taking their business online. This results in so much more digitised, documented data on each and every product / service sale compared to its physical counterpart. Even in much more “slow-to-change” businesses, online presence of any company is almost a given today and almost all data is digitised.
I see the growth of the data analytics industry as a direct extension of this trend of companies being fed with massive digitised data on all aspects of their company. This “Laggard” section of companies initiating the incorporation of DA shall be a major driving force of the growth. The COVID -19 pandemic behaved as a perfect catalyst to this process of transformation. Pre-pandemic, companies that were ahead of the curve and had invested in data analytics and other digital areas had clearly come out on top compared to ones that had not.
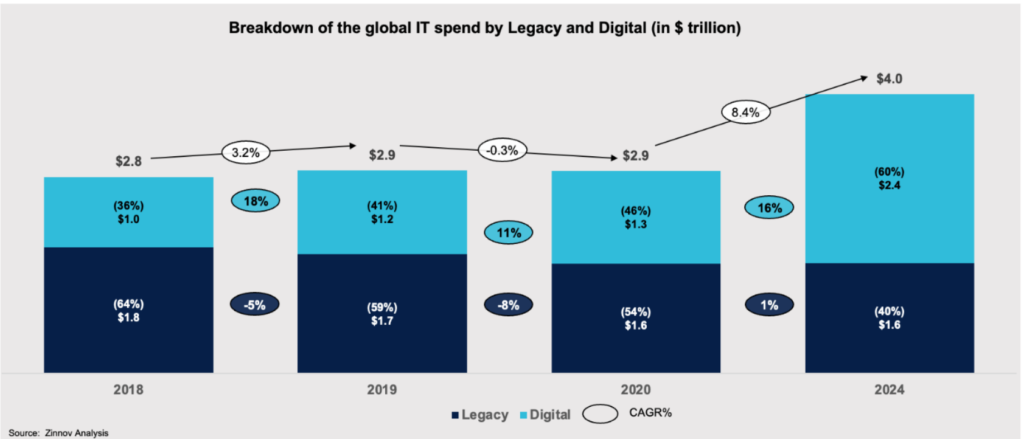
A look at the graph below gives us a glimpse of this transformative process in IT spending. Note the steady rise in the digital spending (of which DA is a part of) both as a whole and as a fraction of the total IT spending :

The Leaders increasing DA spending: The scope for increase in DA spending in companies that have already incorporated DA. Even in these “leaders”, there is a huge scope for increase in DA spending. Most companies still use DA as a “fringe” operation for specific purposes and it does not cut across the entire organisation as the CEO Rajan Sethuraman rightly mentions in an interview. An increase in DA spending will follow as the companies incorporate it across the board.
I believe in the next 5-10 years, data analytics will play an undeniable part in the decision making process as companies witness increasing margins, sales and other measures as a result of “number-backed” decisions. DA spending will be considered as an essential part of expense like advertising or R&D.
General Operations
Latent View Analytics is a pure play data analytics company and it offers a complete (all the 4 phases) data analytics service. Its has been providing business solutions for various MNCs and other big fortune 500 companies such as Uber and Adobe. Its main market has been and continues to be US with about 95% revenue coming from the region. The company, however has been working towards expansion in the Europe and other regions. As for the industries it works with, majority of its revenues come from Tech Companies – about 70%. The rest 30% comes from financial, retail and other industries.
Quality check: Business quality, growth prospects
I would like to use an approach illustrated by Philip. A. Fisher in his book ‘Common Stocks and Uncommon Profits’. In the book, he provides a list of parameters to check of in a good quality business. In this section, I have attempted to evaluate how Latent View Analytics as a business holds up against some of these parameters.
Business questions :
1.Does the company have products or services with sufficient market potential to make possible a sizable increase in sales for at least several years?
Yes. The company offers Data Analytics services which have a huge market potential in the upcoming years.
2. Does the management have a determination to continue to develop products or processes that will still further increase total sales potentials when the growth potentials of currently attractive product lines have largely been exploited?
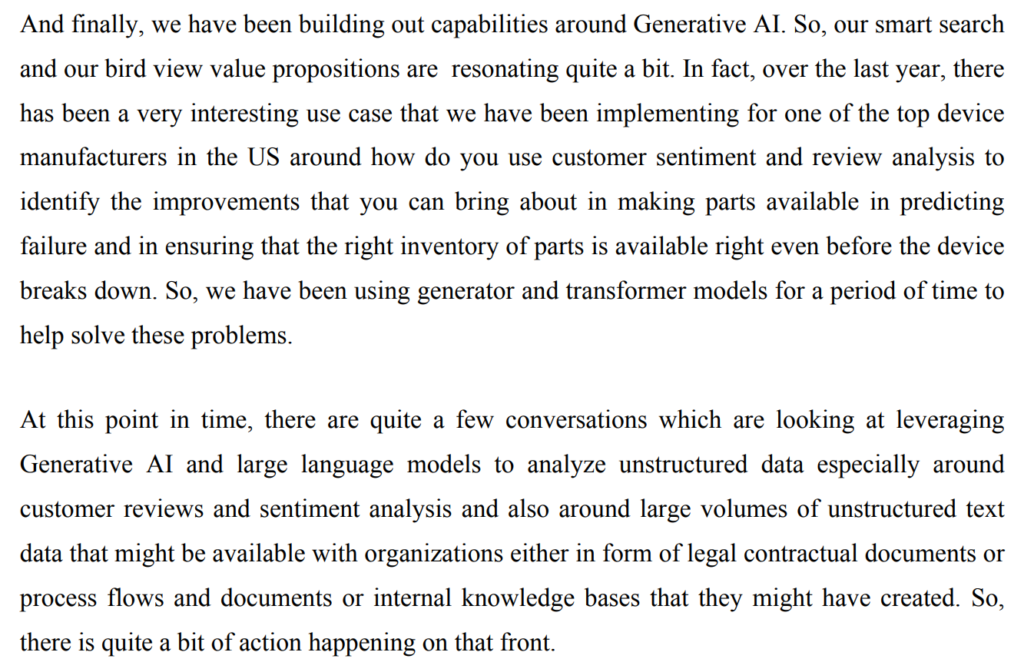
Yes. The company, even as it tries to capture a bigger and broader market and provide its current services, is working towards including rapidly evolving tools such as generative AI to enhance their current services as well as open up new avenues of service which can bring in more sales.

3. Are there other aspects of the business, somewhat peculiar to the industry involved, which will give the investor important clues as to how outstanding the company may be in relation to its competition?
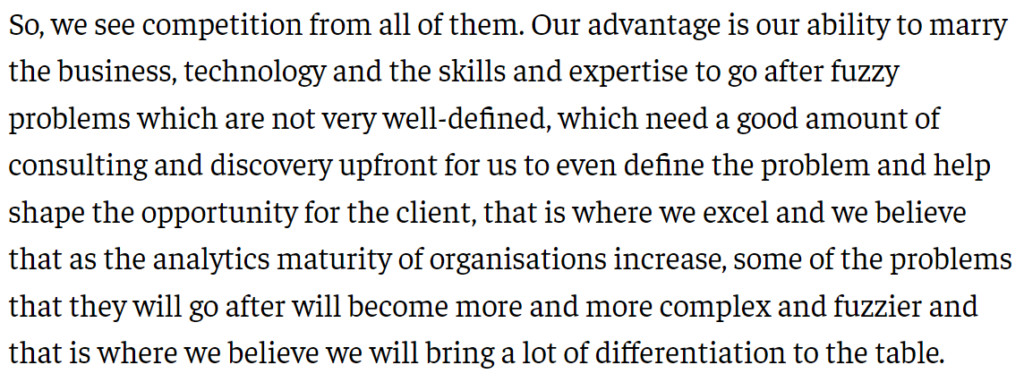
Latent View, being part of the pure-play DA sector, faces competition from both its own segment and other big companies who also provide DA amongst other services. Latent View analytics is the only pure-play data analytics listed company in India and it provides a good opportunity for investors looking to gain from the growth of this sector, given they buy with a margin of safety. (check Valuation).


4. How effective are the company’s research and development efforts in relation to its size?
The company has not spent on R&D in the past but I expect the company to begin R&D expenditure on tools like AI to bring about growth. The company is also looking to grow through acquisitions. One of the major reasons the company went public was to raise capital for growing through acquisitions. The management continues to look for the right company to acquire.
5. Does the company have an above-average sales organization?
Yes. The company has a good sales organization. The company’s average order size has risen from $150,000-200,000 to $600,000-$700,000 over 3 years. The company also has demonstrated its ability to retain the big companies it works with. About 85% of its revenue comes from recurring customers.
Management : Who
Latent View Analytics was founded by Venkat Vishwanathan and Pramadwathi Jandhyala in 2008. Vishwanathan (founder) is an IIT and IIM graduate with years of experience in the field of technology and management. Pramadwathi Jandhyala (co-founder) is a BITS and IIM graduate who has previously worked in IBM, Ford, Moody’s ICRA and Kotak Mahindra Bank. The CEO is Rajan Sethuraman, a BITS and IIM graduate, who has organisational experience with companies like Accenture and KPMG.
The company has an outstanding labour and personnel relation. It also has not had any issues with the law in the past. The company has a management with unquestionable integrity and one that is very passionate too. The management has a long term view with “sustainable growth” as their core aim.
Management Salary
The remuneration of the Promoters and the Management looks very reasonable and justified. The promoters, CEO and CFO salaries as a % of PAT can be seen in the below table :

The Numbers
Financial Health, Efficiency
The company almost has no debt. It is not a capital intensive business. The debt/equity of the company (as of Aug 2023) stands at 0.02 and its interest expenses are negligible. The company has no issues regarding debt.
The company has historically been maintaining 25-30 % operating margin. The CEO mentions that they look to maintain this number in the upcoming years. The ROE of the company stands at about 14%.
Valuation and Conclusion
I would like to value Latent View Analytics using a 3 part valuation method and then consider what % of the total market cap these parts occupy. The first part values what is already there. In this part, I consider a minimum cash flow that I think the company will continue making each year for the next 10 years and discount it at a risk free rate to determine the value. I shall be considering the 10-year Indian government bond yield as the risk free rate. The second part values what is likely to emerge. Here, I shall consider a nominal GDP growth of 12% on the cash flow and value it for 10 years. The third part comprises of the value component that emerges from all the other future potential relating to the company or industry or other premiums on the competence of management. By structuring the value of the stock in this manner, I can segregate the value parts into ones that are more “reliable” or “solid” and ones which are dependent on future outcomes to drive the value. On this scale of how “reliable” the value is, the first part works with what the company has already achieved thus making it the most reliable. The second, comparatively less reliable. The third is the least reliable since it is based on claims on future outcomes. These premiums “catch up” only if those outcomes turn out to be favourable.
1st part : I think, Latent View Analytics will continue to generate at least 100 cr in free cash flow for the next 10 years. The 10 year govt bond yield stands at around 7%. Thus giving me a value of around 1500 cr.
2nd part : Using a 12% growth, on the 100cr cash over 10 years, this gives me an additional value of about 1700 cr.
These two components give me a value of about 3000-3500 crores. The current market cap of the company is around 8300 crores. Thus giving me a split of 18% — 20% — 62% for the 3 components respectively.
I feel Latent View Analytics would be an good investment opportunity if external conditions cause the market cap of the company come down to around 4000 crores.
The company has grown from a sales of 33 cr to around 540 cr growth in a 10-year period. That is around 32% CAGR growth. I think in the next 10 years the company will at least continue to grow at a 25% CAGR. The company generates about 100cr cash today and in 10 yrs lets say the company is making 5000 crores in sales and 1000 cr in cash. I would value the company at about 16,000 crores in 10 years. That is about 2x from today’s market cap. That gives us about a 7.2% CAGR return over 10 years. The 10-year government bond currently offers a similar return, making this a not so attractive investment option.
Thus I feel that despite the attractive and scalable business of Latent View Analytics, I think its current price does not provide an investor with an investment opportunity with satisfactory gain and a good margin of safety.
Books Behind the Analysis

